by Irma Havlickova, Powerhouse Museum Web Producer
and Dr Adela Sobotkova, Archaeologist and Satellite Remote Sensing Specialist
One of the techniques used during the Zagora Archaeological Project in 2013 was satellite remote sensing. This is the analysis of one or more photographs taken from a satellite to indicate where further exploration is likely to be most productive. In the case of the Zagora Archaeological Project, remote sensing was conducted in a radius of five kilometres around the site of Zagora, to look for evidence of archaeological remains or geological features in the environs of Zagora, further exploration of which may reveal more about the Zagora settlement.
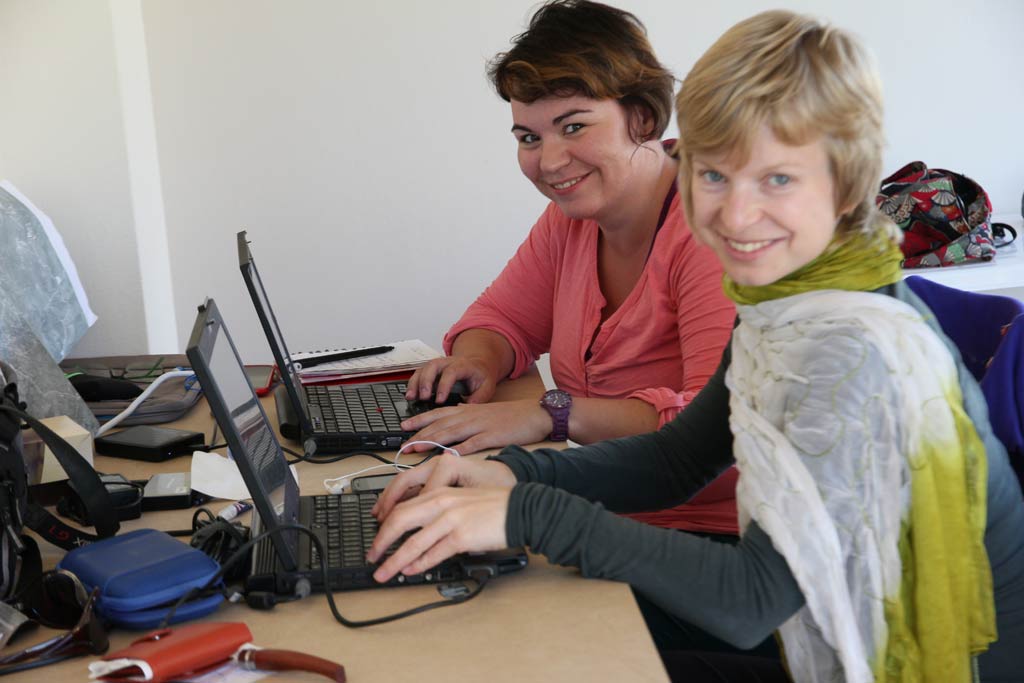
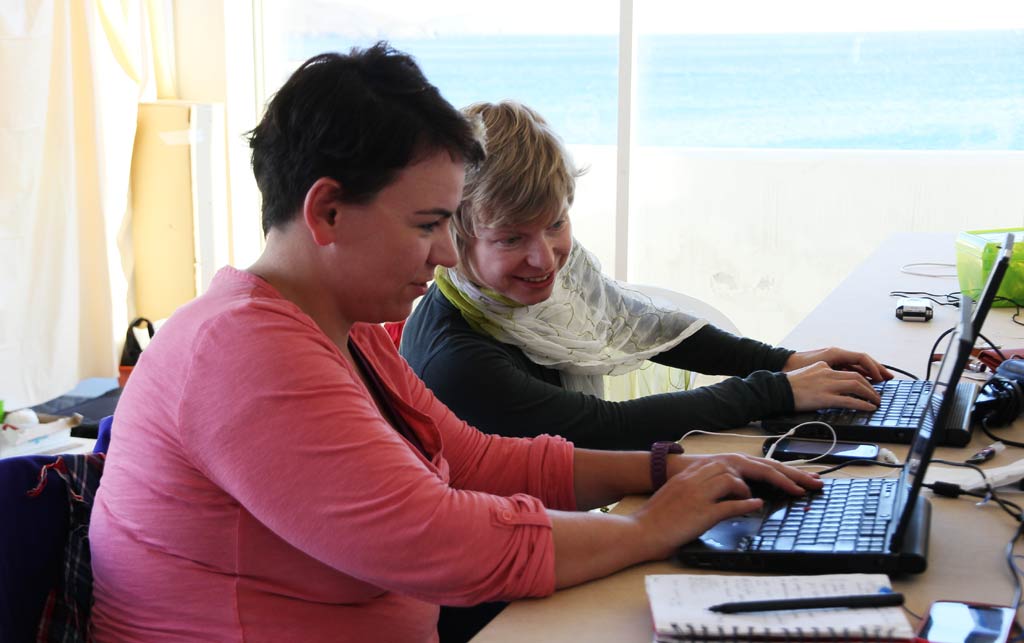
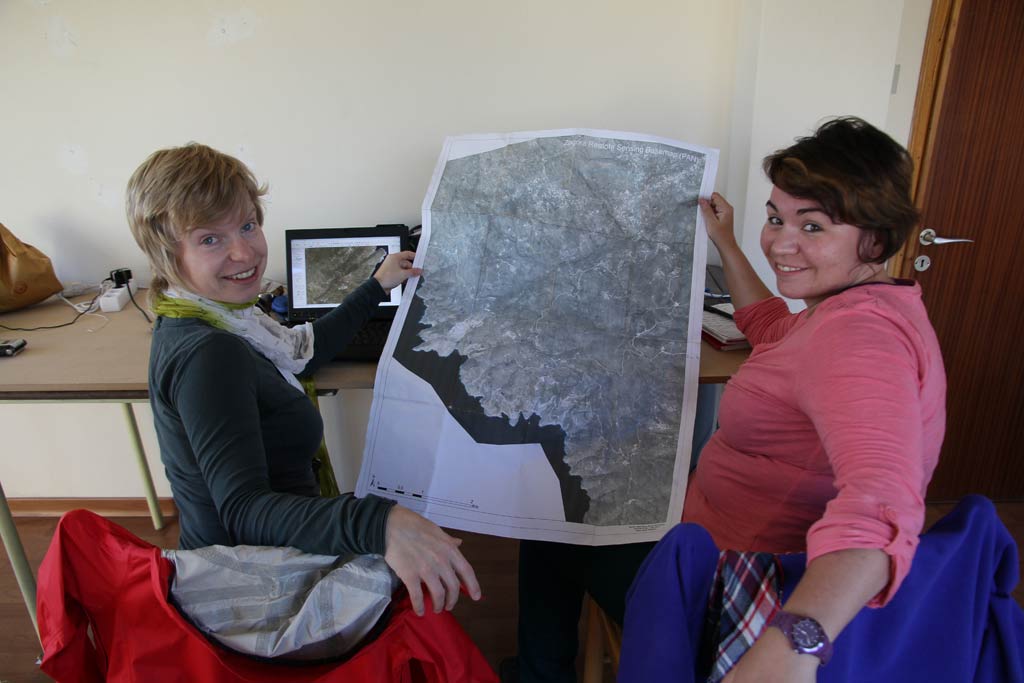
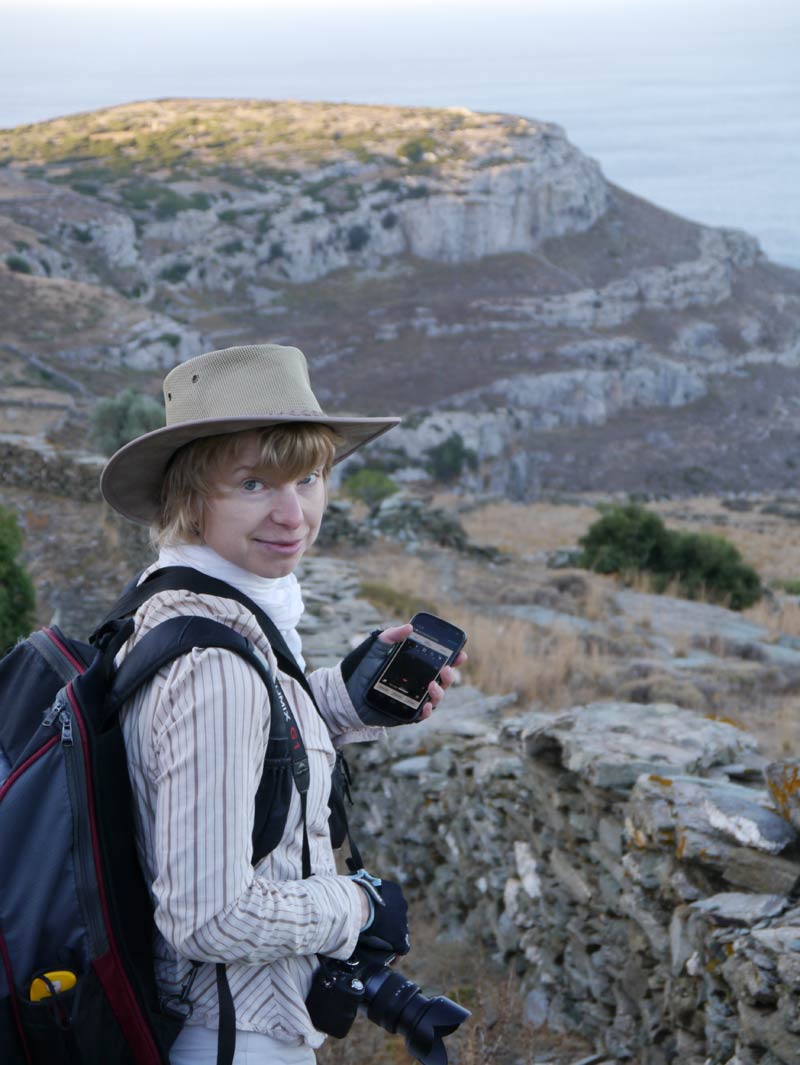
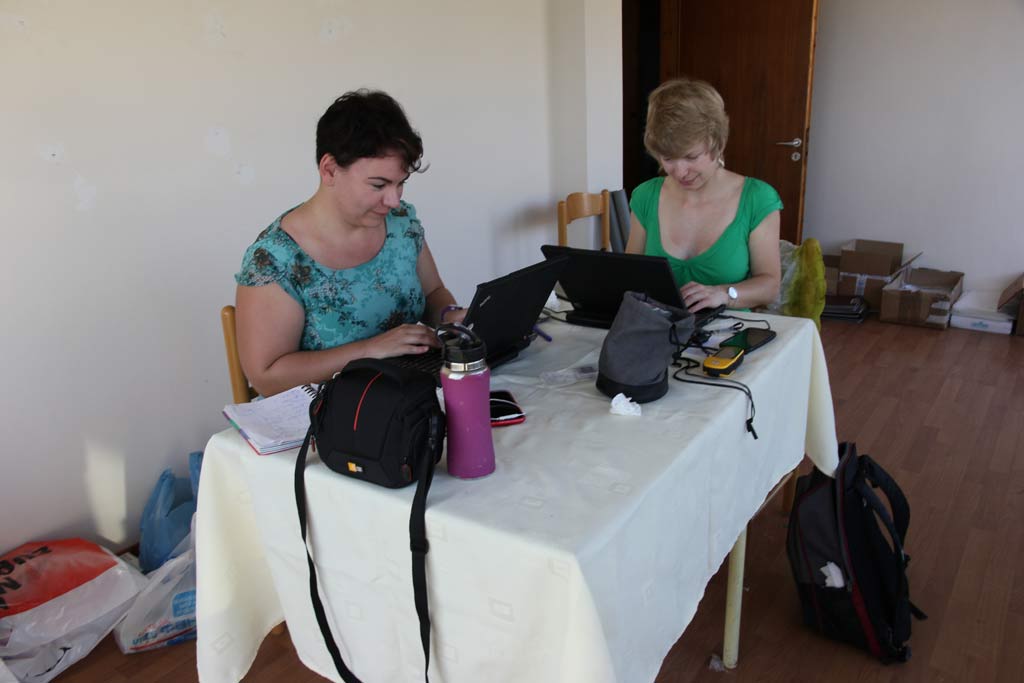
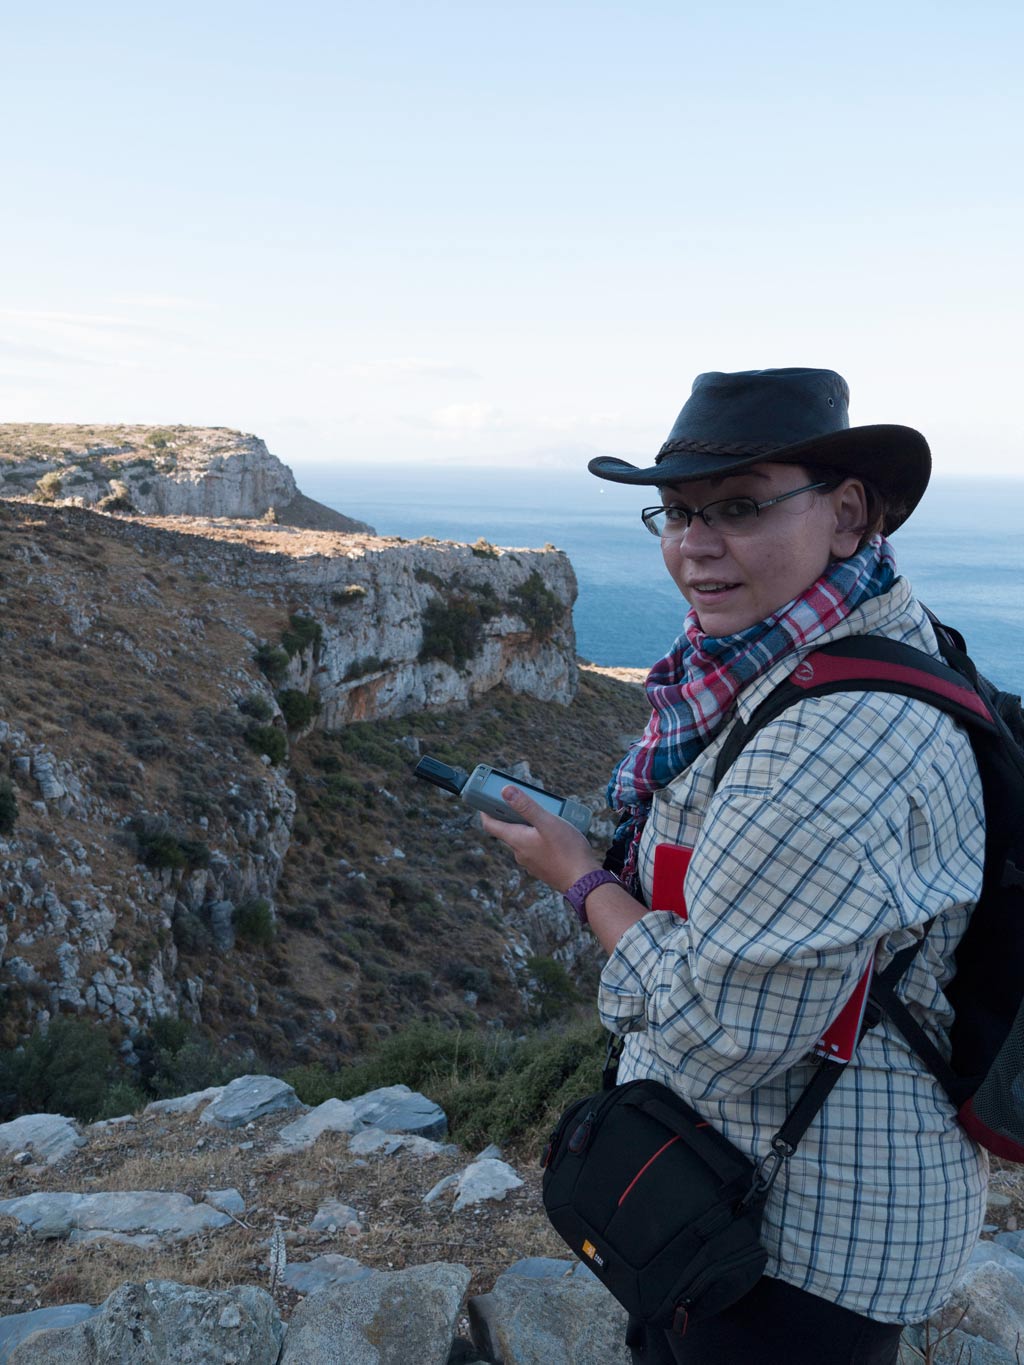
Satellite remote sensing was conducted around Zagora in 2013 by Dr Adela Sobotkova (Research Fellow at the University of New South Wales (UNSW), managing the Zagora remote sensing) and her colleague, Petra Janouchova, (Ancient History PhD student at the Charles University in Prague, and Adela’s assistant).
Satellite remote sensing is a developing field as the quality of both satellite photography and the analysis software improves.
Seeking archaeological remains and geological features
In 2013, the Zagora Archaeological Project started using satellite images to look for two things:
– archaeological remains indicating past human activity – particularly during or close to the period of the Zagora settlement, about 900-700 BCE; and
– geological features which may indicate resource availability around Zagora – for example, the presence of water sources, minerals, etc. which may throw light on either life at the Zagora settlement or reasons for its abandonment.
Indications of past human activity in a satellite image
As Adela explains: ‘There are three main ways you can go about looking for traces of past human activity in a satellite image. It is, basically, one large map, and you just need to know how to read it well.
‘The first one is: you look for any rectilinear patterns that may look like something ancient, which means ideally they will not align with modern field boundaries or with modern settlements. They will look more worn and be older. If you look at an aerial photograph, all the modern houses will be sharp with clear usually white reflections. An ancient site will probably look more like maybe crumbling rock. It will be more diffuse, less prominent. It will more likely have rounded borders, etc. Those would be some of the things you’re looking at in terms of rectilinear patterns, maybe circular structures as well or circular marks in the ground. They would be some morphological keys we are looking for.
‘Then, second, there are the spectral signatures. [Spectra are the bands of colour in white light, and valuable information can be gleaned from the satellite image if we interpret the spectral signatures correctly. More about panchromatic and multispectral images, below.] We can plug into ArcGIS (a Geographic Information System for creating and visualising maps and geographic data) different bands of the multispectral part of the image. Can we see any infrared marks on the ground? Can we see some unusual or unexpected colour reflectance and, if we do, then do they have a pattern to them? This might indicate a strange type of soil, or maybe it’s a sign of buried or latent remains of some sort.
‘The third thing we would look for would be morphological patterns, where you look for alignment in the current vegetation. For example, imagine an old city like Zagora, where you have collapsed walls and houses. Bushes and shrubs will often grow in them because there’s moisture that will get caught in the rocks. And then you will get these rectilinear patterns in the vegetation. They can be rectilinear or circular depending on what structure is underneath them. That would be the third kind of thing we are looking for.’
Commissioning new or purchasing archival satellite images
Adela: ‘The type and resolution of satellite image you decide to use should be informed by the questions you’re asking, by the scale of the region you’re looking at and by the size of the archaeological feature that you’re trying to target.
‘Usually, the commercial satellites take images from about 700 kilometres above the surface of the Earth and have different sensors, which determines the resolution and type of data they can collect.
‘You can commission the capture of new satellite image/s for your purposes or you can purchase archival images from satellite imaging companies. The latter is less expensive, so it was the preferred option for Zagora if an appropriate image could be found. Another advantage of purchasing an existing image is that you can have it straight away; you don’t have to wait for it.
‘If you commission a new satellite image for your area, you get to specify your criteria for the capture. You can select a two- to three-month window of time, when you would like the image captured. It can’t be any more precise because the satellites need to be programmed to fly over your study area and capture images to also accommodate your other specifications. These include considerations such as how much cloud cover are you willing to tolerate, and the angle of view of the satellite towards your study area.’
For the Zagora Archaeological Project, Adela first looked at the archival images available from several companies which produce sub-metre resolution of the imagery. (Sub-metre resolution means every pixel in the image represents roughly one metre square on the ground or less, which is great to look for remains of houses and structures of similar scale.) She found a high resolution, cloud-free image of Andros among the archival images available from Digital Globe. It suited ZAP purposes, so an area of 10 square km centred on the site of Zagora was purchased.
Benefits of using panchromatic and multispectral satellite images
The purchased image included a panchromatic and multispectral component. The panchromatic image looks like a black and white photograph. It captures visible light and has half a metre resolution (meaning that there are four pixels in the image for one square metre on the ground). Even a tomb may be identifiable at this spatial resolution.

While the bands contribute additional information, the multispectral image has lower spatial resolution than the panchromatic one (one pixel represents four metres square on the ground in the multispectral image).
As Adela told me: ‘A huge advantage of using images provided by satellites in comparison to doing aerial imagery with your own camera is that unless you have specialised filters, you only capture the visible light with the camera. But satellites use specialised multispectral sensors that can capture near-infrared one, near-infrared two – different bits of the bandwidth of the electromagnetic spectrum as well as capturing the visible red, green and blue light. The satellite imagery purchased for ZAP 2013 records eight different spectral bands, substantially extending what the human eye can see or a standard digital camera can record.
‘For archaeology, we mostly use the near infrared bands, mainly because near infrared is emitted by very healthily growing vegetation that may be growing over ditches, or cuts, or areas where somebody has excavated something or buried something. They can be good proxies for latent subsurface features.’ [Another way of saying that is they can be good indicators for something below the soil surface that warrants examination.]
‘Our human eye would not be able to pick up the difference between very green and just green in this healthy growing vegetation but in the infrared band these two provide a striking contrast. You can actually see readily if you load and display the infrared band. That’s perhaps one of the best examples for some of these multispectral characteristics.
‘Another important advantage for geologists and archaeologists is that different types of soil chemistry produce different spectral signatures. Different types of rock emit or reflect different parts of this spectra, of these bands. They emit light of different “colours” (actually it is bandwidth displayed as different colours) that indicate their chemical composition.
‘All of this provides information about the surface. If you get bedrock or if you get sands on a barren landscape, you can very easily tell whether it’s limestone or a quartzite sand, what kind of rock or bedrock or substrate you are looking at. Which is why, originally, satellite imagery was mainly used by geologists for prospection.
‘Archaeologists, since we like to pick up our methods and techniques from geologists, have expanded and fine-tuned the methodology of remote sensing. It helps if you know your local clays very well: by tracing some of these spectral clay signatures you can identify places where people took particular types of clay from [to make pottery].’
Imaging software (special pricing for students)
You need imaging software to analyse the multispectral image. A couple are free to download, such as FreeView Geomatica which enables you to view the image, recombine the different bands, and play with them. You can learn what your image is about. But as you’d expect, being free, its capability is a bit limited.
Then there is professional spectral imaging software, such as ERDAS Imagine. Licences are very expensive unless you are a student.
Adela highly recommends that all Archaeology students get a reference letter from their University adviser and apply for a specially priced ‘student’ licence to use ERDAS Imagine which at the time of writing in 2014 was only $100 per annum. This is a greatly reduced price on the standard price of some thousands of dollars. Adela described it as ‘very very worthwhile’.
She continued: ‘It is not a very intuitive software. It’s got a barrier of entry into it. But it will let you play. It’s very robust. You can not only view the images, but you can do arithmetic* operations on them, using the numeric value of each of the red, green and blue (RGB) channels which make up a colour image.
You can ask the software to classify the image for you. For example, you can ask the image, “What types of soils do I have?” The software will go automatically through the image, and classify the different spectral signatures it sees.’
*[Here is an explanation of how you can do arithmetical operations using colours: Red, green and blue are the additive primary colours of light which can be added (mixed) together to create all the colours we can see. Each of these colour channels of red, green and blue has a numeric value from 0 to 255. For example, the numeric colour value for each channel of black is Red = 0, Green = 0, Blue = 0 (because black is the absence of colour in the additive system), so the RGB value for black is 0, 0, 0. The RGB value for blue is 0, 0, 255 (no value for Red and Green, and full value for Blue); crimson is 220, 20, 60 (with the highest value for red and the lowest value for green); and white is 255, 255, 255 (because white is the addition of the full value of each of the colours of Red, Green and Blue). If you’re surprised that the absence of colour is black, and addition of all colour values is white, that is because we are talking about colour as we see it reflected as light, and which is called ‘additive’ colour. In additive colour, if you mix red and green, you get yellow. ‘Subtractive’ colour is the colour as it relates to dyes and paints, in which the primary colours are yellow, red (also called magenta) and blue (also called cyan) – where you’d mix yellow and blue to make green.]
Supervised classification
One of the powerful capabilities of ERDAS Imagine software is the ability to do supervised classification. This means you are able to train the software to automatically identify features (such as plants, rocks, soils) in the image on the basis of your prior knowledge of a small but representative area such as Zagora.
Then you feed your observations from the small sample into the software and apply the knowledge acquired from such small samples to the entire image.
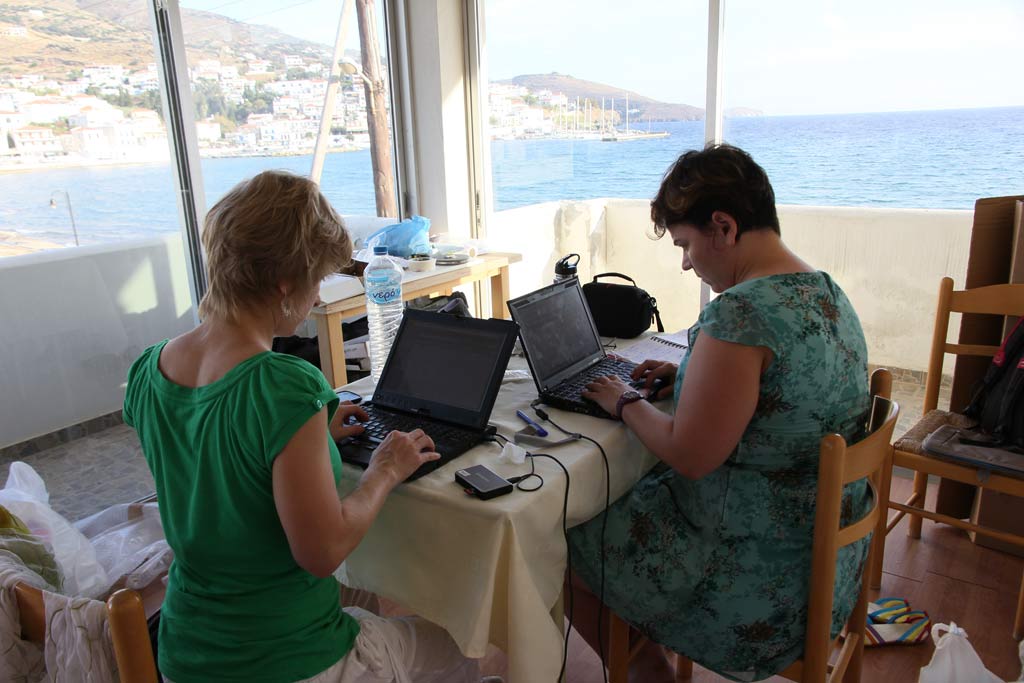
Looking through the window from the ZAP office in Batsi on the day I interviewed Adela and Petra in October 2013, I could see a hill about a kilometre away. I asked Adela if it would be possible for me to photograph a hill I could see through the window, I guessed about 700 metres away, and use ERDAS Imagine to analyse the soil in the hill.
Adela explained: ‘You should be able to do it, if you don’t have much vegetation covering the soil up. You would need to draw an outline around the bit of the hill that has the particular soil you wanted to know about. What the software basically does…. it’s not that smart…. it doesn’t know that it’s looking at soil. It will look at the boundary that you have drawn on the picture, and it will try to find similar areas in the image that have the same spectral signature. That gives you the most powerful and meaningful analysis. You can also ask it to classify the image, in which case if you take a picture of that particular hill, it will probably break it up into about 15 categories of different spectral signatures and represent them by different false colours. You can also ask it: give me 50 categories. Then it will give you finer ones, but they will likely overlap.
‘You will mostly get categories of land use, maybe two or three categories of soils, two or three categories of rock. That’s what the image will do, but it will not know that that’s what it’s doing. It will give you: class one is very light grey, class two darker grey, class three orange-yellow, and then you need to look at the image. The software will actually put little boundaries around these areas and then you just say OK, I know this is a bit of sand, and you type it next to it into a label.
‘Then, you can maybe take that image and tell the software, “Remember this for the future,” [ie, that that colour signifies sand] and then you feed it a large satellite image and say, “Use this template that I created yesterday, and divide up this satellite image in a similar way, using the same spectral ranges.”
‘Then, it will run it on the whole satellite image. But yes, that is called a supervised classification where you train the software first, and then you apply it to a larger area.’
Preparatory work in Sydney and on Andros
Adela ran various enhancements on the satellite images using ERDAS Imagine at UNSW before going to Andros. First she merged the higher resolution panchromatic image with the lower resolution multispectral one. (This is called ‘pansharpening’ the image.) Merging the images gives the benefit of the high resolution of the black and white image with the information provided by the colour bands of the lower resolution multispectral image. Adela then did some edge detection and band recombination, trying to tease more information out of the image.
She found quite a lot of modern structures as well as structures from the last 300 years or so, which are hard to distinguish from ancient remains. In the first computer passes, the software, as Adela described it, ‘went berserk and found every wall in it, so it looked very, very noisy’. Adela then did a ‘normalised difference vegetation index’, an arithmetical operation using the near infrared bands to try to extract information about healthy and unhealthy re-growing vegetation. She was trying to glean information about the vegetation and get an idea of what may be beneath it.
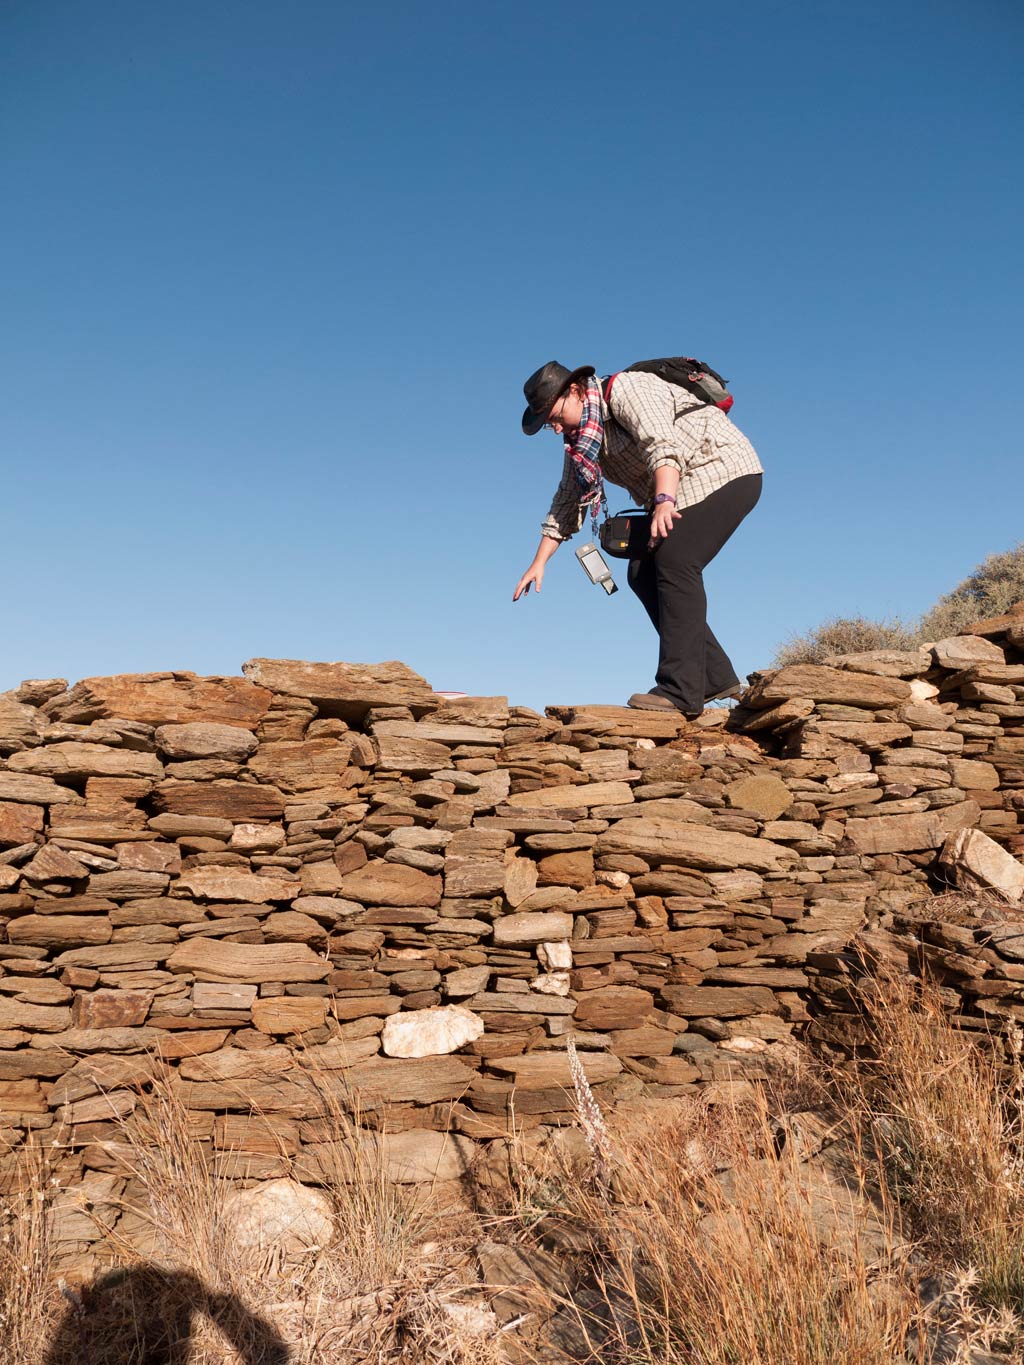
Once on Andros, Adela and Petra quickly realised there was a positional error in the satellite image: locations on the image, such as major road intersections, were not aligning with their GPS readings as they travelled through the landscape. They had to assess the error and rectify the image location details using precise GPS readings.
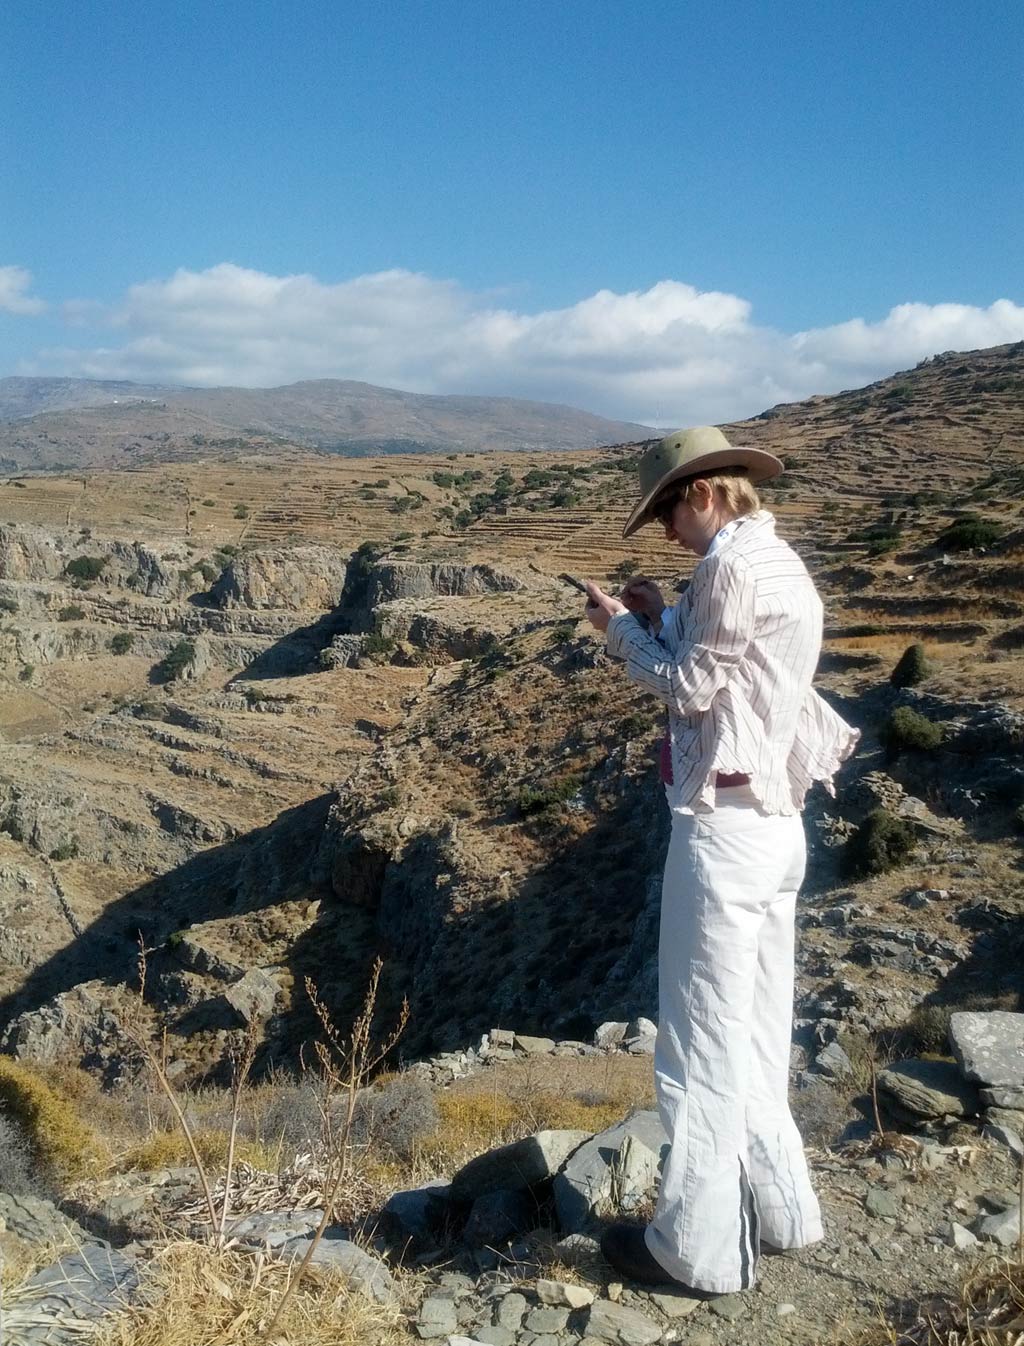
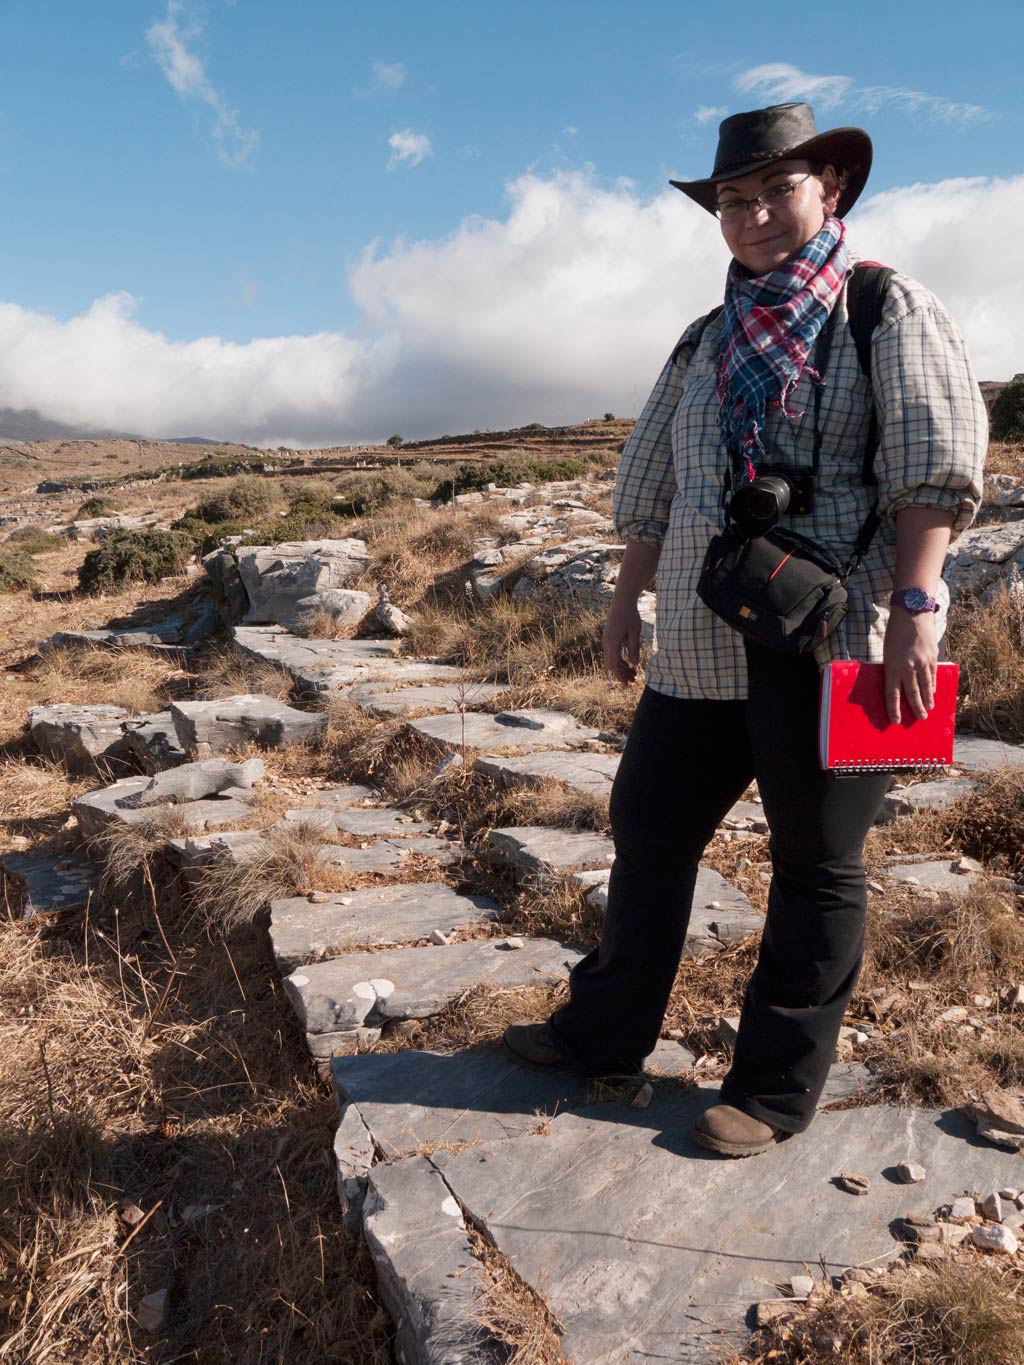
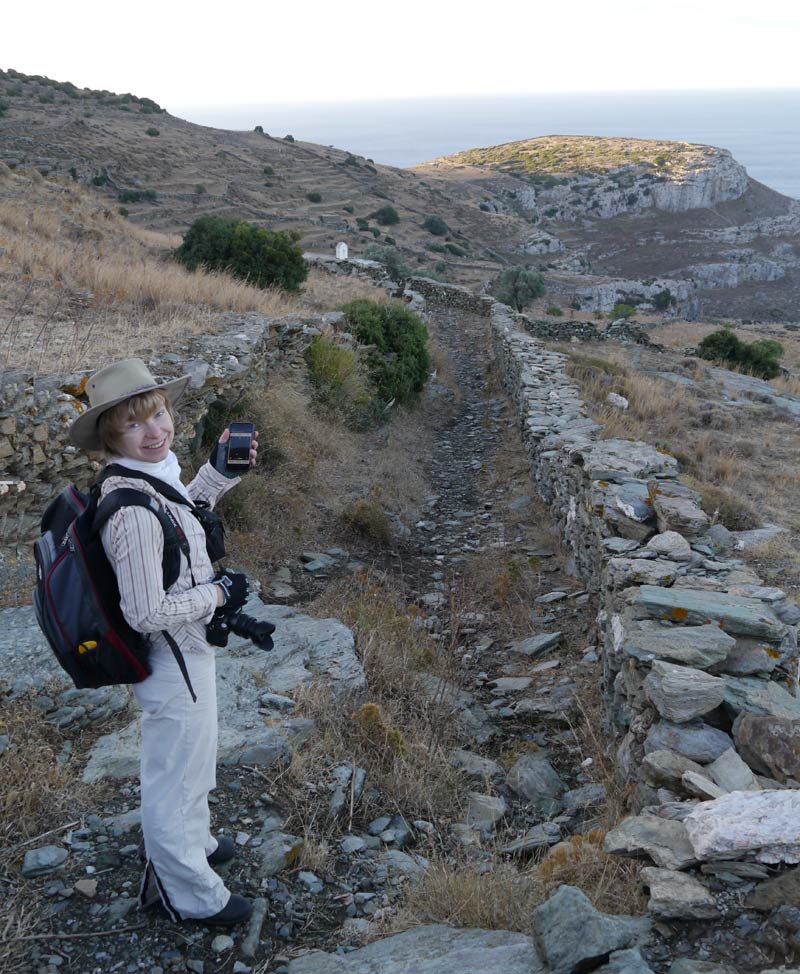
Their rectification process is similar to what surveyors do: they travel around and take GPS points, marking their locations in the printout map. They try to use areas that have a good view of the sky, so that they can obtain as precise a GPS (Global Positioning System) point as possible by being in the field of view of several GPS satellites.
Once they get into the office they download the GPS points and link them to the appropriate spot in the satellite image on their screen. Detailed drawings of GPS locations on the printout are essential for an accurate and unambiguous match.
As Adela explained: ‘Thanks to the GPSs we used, we managed to rectify our image to about five metres. I’m happy with that.’
Getting your eye in
We’ve talked about training the software. You also have to train yourself to read the image accurately.
‘Most of the prominent things we see in the image are modern. The things that will immediately pop out are the modern roads, the modern constructions, the modern quarries, because they just jump out. In order to see something older, you need to really ignore all of these modern intrusive and conspicuous features, and look for the subtle (and potentially ancient) ones. It’s all about stripping this noise out and being able to focus your eye.
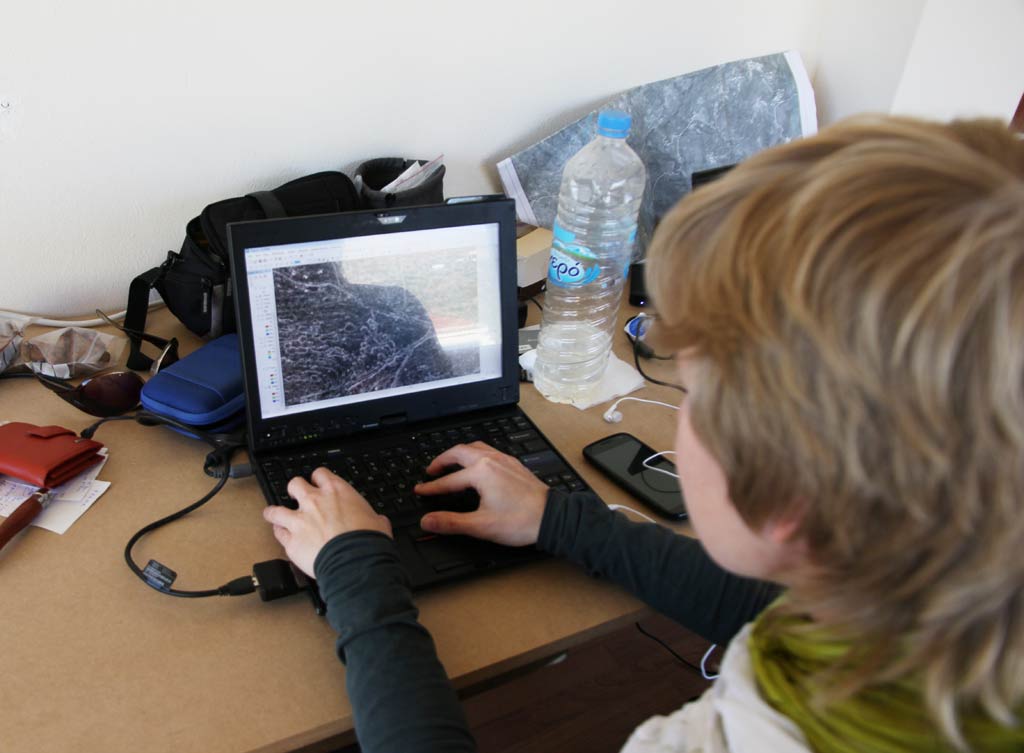
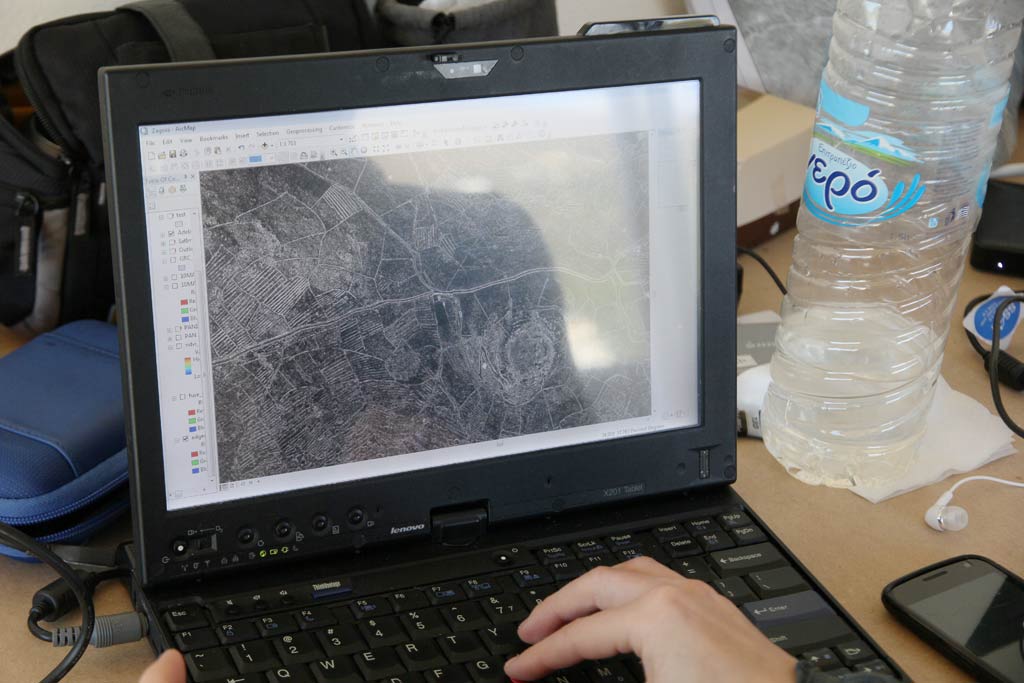
We were not using the supervised classification while on Andros because we were unable to use ERDAS Imagine there. Instead, while on Andros, we analysed the image manually, meaning visually. We use ArcGIS which lets you view the imagery, but it doesn’t let you run all the analysis. You can at least look at it and zoom in and maybe record some stuff on top right into your geo-database.
‘Human eyes are much better trained to look for patterns, even in areas where computers would consider them negligible. I have some images where I was trying to force the computer to detect the little edges, and all you get just looks like wonderful modern art, because it detects these edges everywhere. If I set it on subtle features, it will just pick everything up and then you don’t see the forest for the trees. It just gets very noisy and messy.’
Petra: ‘It’s different in every country; it depends on the terrain on the surface. Here on Andros, there are so many modern structures like all the walls and terraces. It’s really hard to concentrate on what you’re really looking for, to ignore all those walls.’
Adela: ‘You have to look beyond them, yes. It takes a lot of mind space to be able to focus. In the Mediterranean or in temperate Europe, it’s hard because there are so many [modern features which are not relevant to our research]. You need a trained eye. Even ourselves, after having done remote sensing in three different areas over the last six years, it takes us at least a week of really looking at the image, and weeding out the false positives before you are able to more reliably interpret the image.
‘It is crucially important that we do an accuracy assessment and that we measure the success of our interpretations of the satellite image. Remote sensing is more art than science. You look at the image and you use your experience to understand, and to assess what it is you’re seeing. While it may only take you a semester to learn the appropriate software that you need, and to grasp how to display an image, how to process, enhance and sharpen it, all of these things are technical and mechanical. To be honest, they are very easy. Everybody can learn that. What takes time is you need to practise reading and interpreting the image.
Devices recommended for fieldwork
For students interested in doing remote sensing related field work, here are some recommendations for devices to use when recording in the field. Given that the satellite image is digital, it makes sense to record field data digitally as well, based on what’s worked for us in the past. Of course these technologies change rapidly, so there may be other options available by the time you are reading this post.
Adela: ‘We generally take multiple recording devices into the field in order to have a very redundant system because, like all other archaeologists, we are paranoid about losing data.
System 1: As the primary recording setup we would use a consumer-grade handheld computer (PDA or Personal Digital Assistant), with a GPS receiver slotted in for tracking ourselves and for marking waypoints. For a PDA, we have used the Hewlett Packard iPAQ 200 series, which is now rather old as hardware goes, but it still runs the ESRI ArcPAD (mobile version of ArcGIS) we use. We use a Trimble Pathfinder XC as the GPS that slots into the PDA. It is a CF (CompactFlash) card receiver. You slot it in and control it via the PDA.
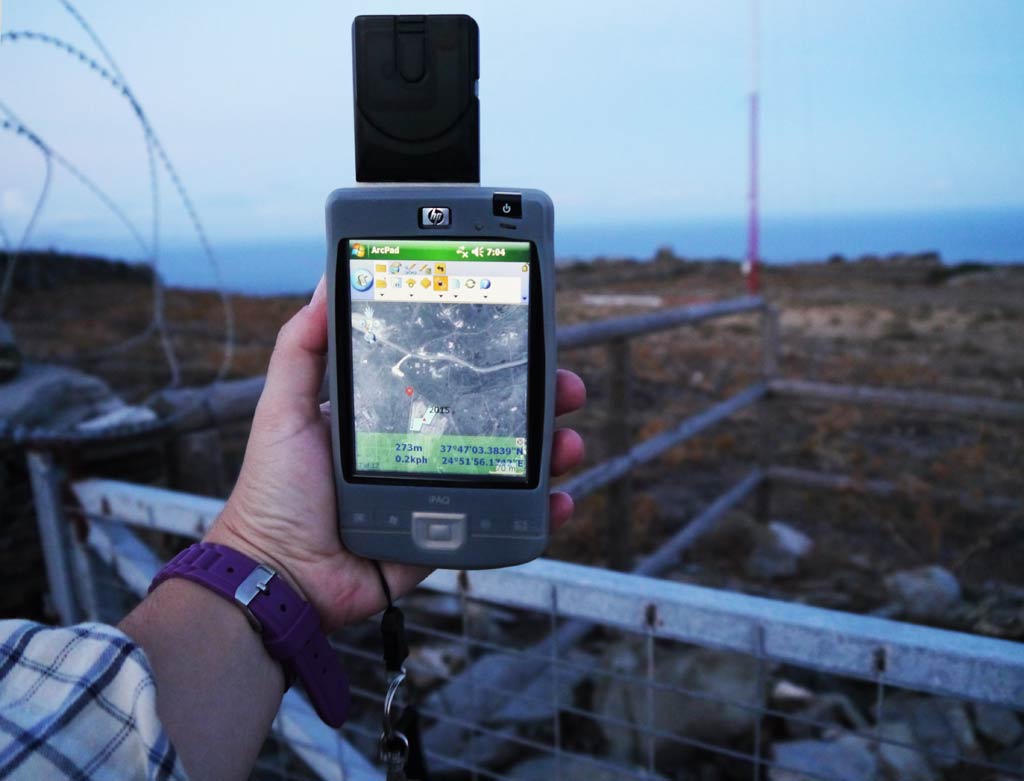
With this set up you can bring up raster maps stored on the memory card in the PDA, manually draw points and polygons and plot points from the GPS.
System 2: We would also use something like a consumer-grade handheld Garmin eTrex GPS as a backup. You cannot load maps on it, so it’s not great for navigation (there are other Garmin GPSs that are more fully featured). However, it takes points and can record a route and does both those things well.
System 3: Nowadays we would use the Federated Archaeological Information Systems Project FAIMS application for archaeological field-recording. This is a GIS-capable Android application that any Android mobile phone can use. You can download the free app from the Google Play Store, load your raster maps and use the internal phone GPS exactly the same way as you would with the PDA.
The value of remote sensing in different regions
Adela: ‘Even with our experience we find lots of false positives. There is no guidebook for this work. With each new location, you just have to grapple with the map, get your eye in and familiarise yourself with this particular location.
‘That’s why archaeology is such an interesting science/humanities discipline. It is different in every country because of the different cultural histories. If we had only 10 types of archaeological sites in the whole world, it would make remote sensing an easy thing because you’re looking for 10 limited types. We have probably thousands of types of archaeological sites, and they vary from country to country.
‘For example, in the Near East, if a majority of your sites are tells, which means settlement mounds, and five or ten percent maybe small villages, then you will most likely pick up all of the tells. Because they’re large, they’re prominent, and they all follow the same pattern. In temperate Andros you have mostly stone built settlements. In Bulgaria you will have mud huts which are much harder to detect.
‘You have constructions made of different materials, of different sizes, of different scale. There are clustered settlements or dispersed settlements. All of these provide different footprints which are much harder to keep track of.
‘You need to know your study area fairly well. It depends on your environment and the vegetation. You may have fantastic features, but like the pyramids in the rainforests of Yucatan: you may not be able to see them, because there are trees covering them up.
‘There’s the problem again of temperate Europe, vis-a-vis the Near East where you have barren arid land where every rock, basically, sits on the surface and you can see it even from the satellite. That’s the other thing, that here (on Andros) maybe there are some sites, but often they are covered by the prickly oak and other scrubby stuff, so they are harder to see.’
Thanks to Dr Adela Sobotkova and Petra Janouchova (a great team) for the generosity with which they shared their information, and for demystifying the technical processes so as to reveal how fascinating satellite remote sensing is.