
by Andrew Wilson, Archaeologist and Database Specialist
representing Arts eResearch at the University of Sydney
with Irma Havlicek, Powerhouse Museum Online Producer
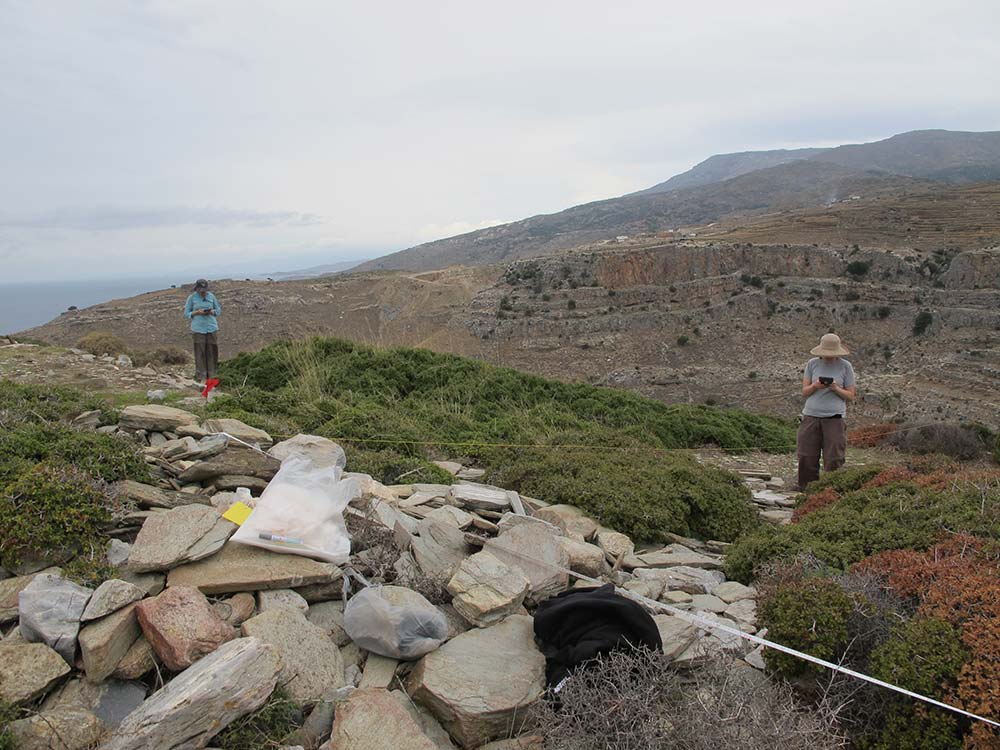
This has to be done systematically so that we can gain an understanding of the entire site. The best way to do that is to walk the entire site, using grids. In this post, I hope to explain how the grid system works at Zagora.
Here is a plan to help orientate you around the Zagora settlement site. It shows a representation of the 217 (20 metre x 20 metre) grids – indicated by the smaller, fine red squares – each of which has to be visually scanned at the site for any indications of Geometric Period settlement life.
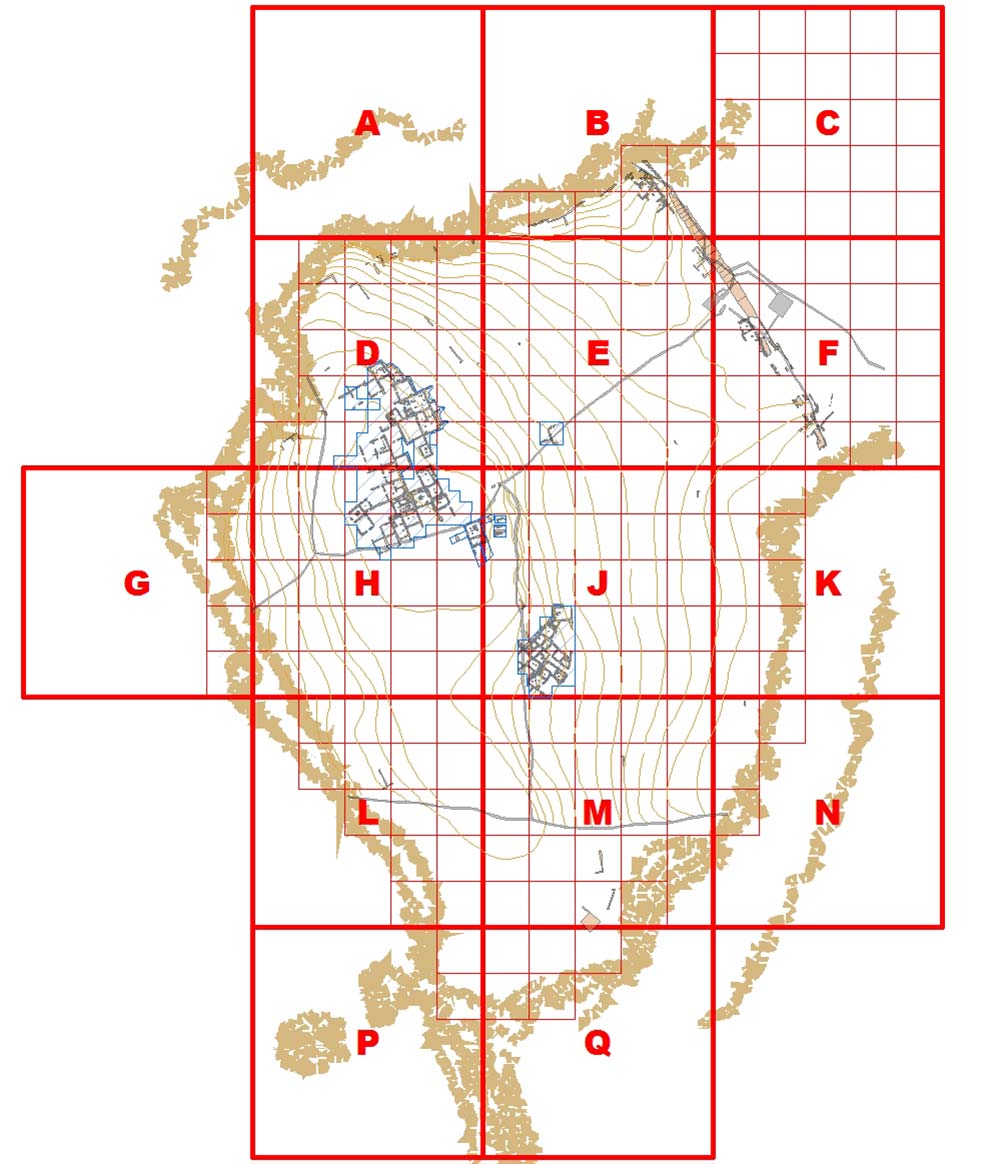
These grids were put in place by the original Australian archaeological team in the 1960s/70s to help locate and map all the details of the site. The same grids are being used by us today which enables us to match their original records with records we create now.
Have a look at the way the 100 metre grid squares (marked by the larger, bolder grid squares in red) are indicated by letters of the alphabet. Do you notice anything missing? (Answer in the next paragraph – see if you can figure it out before reading on….)
…. the letters ‘I’ and ‘O’ are omitted to be sure there is no possible confusion between those letters and the numbers ‘1’ and ‘0’ (zero).
Here is a Google satellite image of the same area, so you can get a feel for its topography and siting in relation to the land and sea around it:
Following is a plan showing a closer view of the parts of the site which were excavated in the 1960s/70s archaeological seasons – the buildings shown here, revealed in those excavations, include dwellings and a temple – which is in square H8060, five grids across and four grids up in the H area. The numbering begins in the bottom left corner of each of the larger (letter-named) squares.
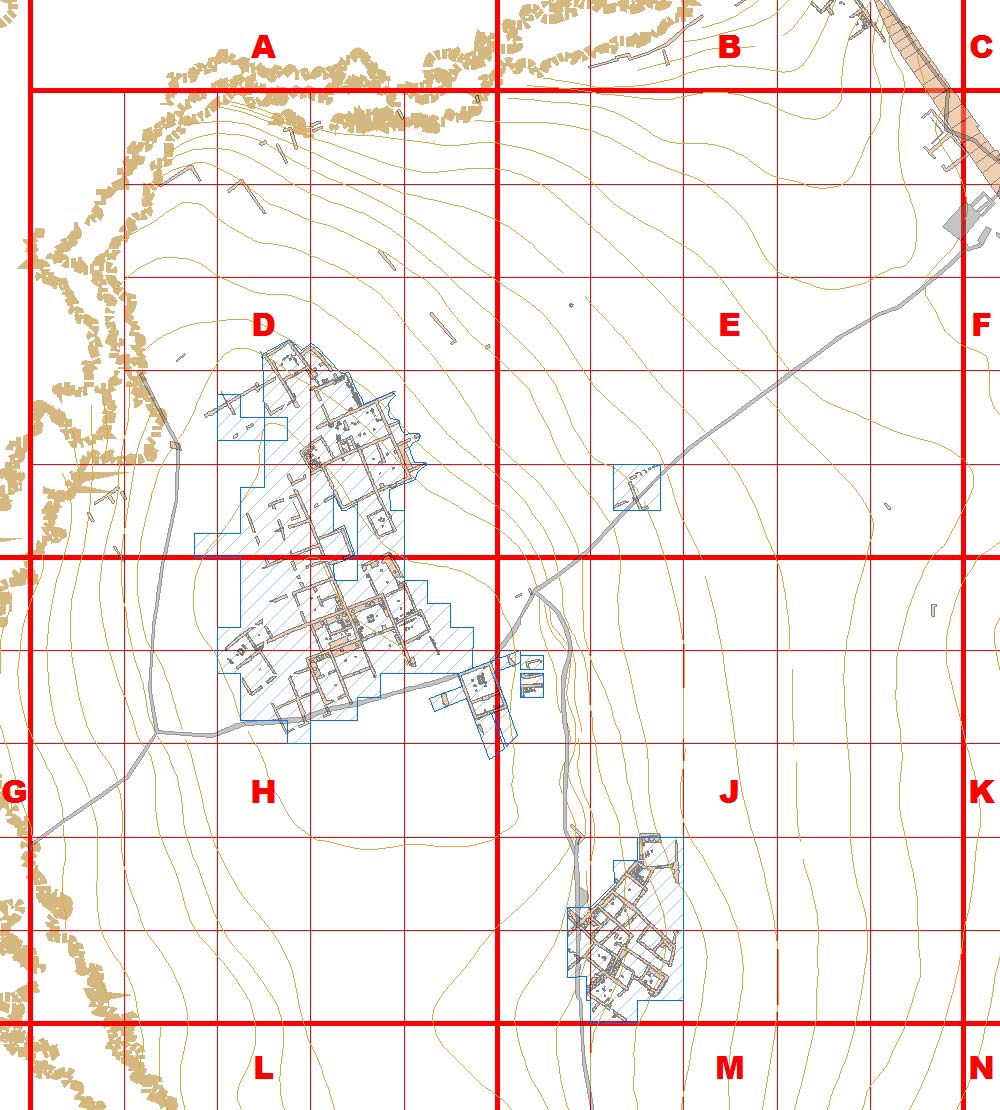
You can see that the excavations in the 1960s and 70s focussed on the 100 metre grid squares D, H and J, with a little also in E.
The following plan illustrates how the numbering works:
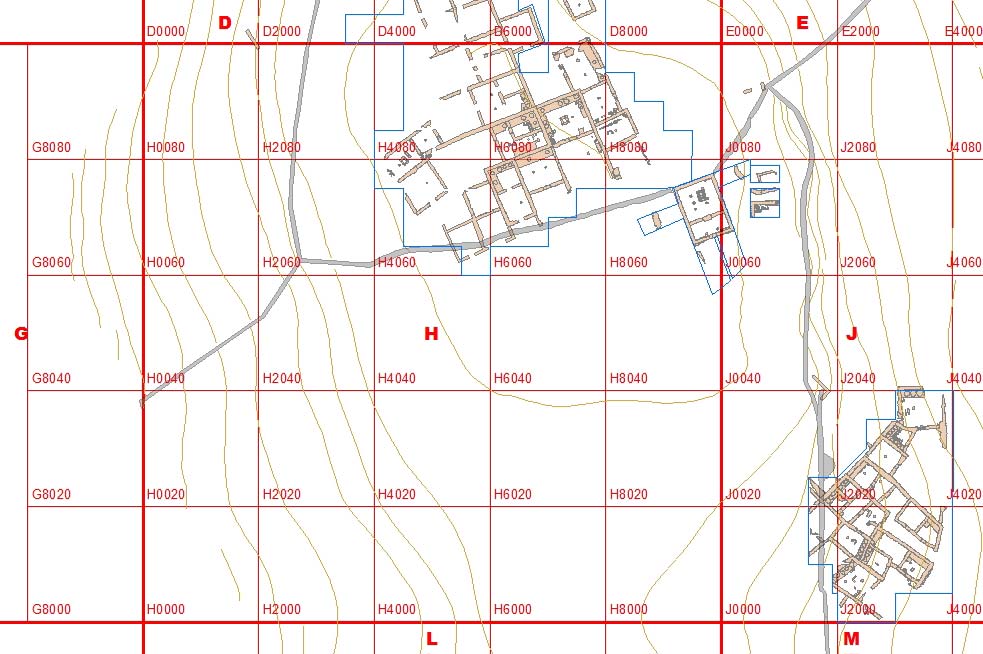
You may be interested to know that the rectangle in the temple at 2060 is the altar.
For this first 21st century dig season at Zagora, we are using the techniques of geophysical survey combined with archaeological reconnaissance to help the archaeological team leaders get a clearer overview of how the entire site was used. It will also help them decide where to dig test trenches this year, and where to plan to excavate further if approval is given to continue the excavations in 2013 and 2014.

2 thoughts on “A geometric grid for a geometric site”
Andrew Wilson’s explanation of his grid is a model of clarity. Of particular interest is the way he shows the relationship between the work of the original Australian research group and this current resumption of their efforts – and the resumption of their original grid. Most useful too is the way that individual features and points of interest are plotted on the grid. Many thanks.
Many thanks for your kind words – I’ll let Andrew know. We’re glad you found the post of interest.